1 Introduction
1.1 Why is it so important to learn more about the spatial distribution of poverty?
- More than 700 million people or 9.3% of the population live on less than $2.15 a day.
- Approximately half the world’s population live on less than $6.85 a day.
- Despite global inequality declining, inequality within countries is rising so it is increasingly important for policymakers to appreciate the spatial distribution of wealth across a whole country.
Social protection programs and appropriate policy decisions are important drivers of poverty reduction but they need suitable data in order to effectively target those who need help the most. Policy makers therefore require the most current statistics as well as figures that give an idea of poverty distribution across the whole country. This method of small area estimation can help solve both of these issues.
Poverty estimates are a crucial measure for policymakers and development practitioners to understand the extent of poverty in a country and design effective poverty alleviation programs. This guide will tell you how to produce these estimates.
1.2 The Fay-Herriot (FH) Model
The FH model in R can be used to produce out-of-sample poverty estimates.
The FH model uses a combination of household data and geospatial data in order to generate estimates of poverty rates.
It does this by fitting a model on the in-sample observations by using the household survey responses and learning which geospatial covariates have the most predictive power on the wealth index variable in the household survey. The model can then estimate the poverty rates for out of sample households using just the geospatial data.
This technique is demonstrated by Blumenstock et al., (2022), who develop relative wealth and poverty microestimates for all 135 low and middle income countries (LMICs).
Why do we use geospatial data rather than census data?
- Previously, small area estimation poverty estimates were generated using a combination of household survey and census data, which is only collected every 10 years. However, a combination of household survey data and geospatial data allows you to generate poverty estimates much more frequently than was possible previously.
- Geospatial data is open source and can provide more precise and up-to-date information about covariates than census data. This also makes the estimation process cheaper if you use geospatial data.
- Geospatial data does not have a problem of finding statistics in rural areas which are often hard to reach in traditional surveys.
Geospatial has all these advantages whilst still offering sufficient predictive power
- Geospatial data is available at a high spatial resolution, which can be matched with the geo-location of households in order to allow prediction of household welfare from the co-ordinates.
- This information can then be used to estimate poverty rates for that household by using geospatial information such as land use, population demographics and climatic variables.
- The FH model using geospatial data, when compared to ground-truth data in Togo using a nationally representative sample of 6,172 households found that the model explained 84% of the variation in wealth. This compares favourably to other state-of-the-art models.
1.3 The guide
In this guide, we will take you through the steps of using the Fay-Herriot model in R to carry out small area estimation to predict poverty rates. This will enable you to replicate this prediction in other developing countries using just geospatial data and a household survey that includes a wealth index. We use the DHS household survey that includes data on over 90 different countries for ease of replication for the user in other countries. We will explain how the model works, the data we use, and why we might choose to use this method over traditional approaches. By the end of this guide, you will be able to produce accurate and up-to-date poverty estimates for small areas in developing countries, which can inform policy decisions and improve poverty alleviation efforts.
In this guide we use the Fay-Herriot model vs other predictive models since the FH model estimates poverty rates using the agglomerated average wealth index of each area (and is therefore known as an area-level model) rather than other models such as the EBP (empirical best predictor) which estimates the poverty rates by generating an estimate for every single household (known as unit-level). This makes the results easier to replicate in a large variety of countries since there is often a problem in obtaining unit-level data due to data protection laws.
Why we use the relative wealth index as our measure of poverty
We use the DHS “relative wealth index” as our ground-truth measure of wealth and poverty. This means that our machine-learning algorithms are being trained to reconstruct a specific, asset-based relative wealth index - albeit at a much finer spatial resolution and in areas where DHS surveys did not occur. This is because we believe the DHS version of a relative wealth index is the best publicly available instrument for consistently measuring wealth across a large number of developing countries.
The wealth index is a composite measure of a household’s cumulative living standard. The wealth index is calculated using easy-to-collect data on a household’s ownership of selected assets, such as televisions and bicycles; materials used for housing construction; and types of water access and sanitation facilities. The wealth index is generated with a statistical procedure known as principal components analysis. The wealth index places individual households on a continuous scale of relative wealth. However, since it posits a specific, asset-based definition of wealth, it does not necessarily capture a broader notion of human development.
Our decision to focus on estimating asset-based wealth, rather than a different measure of socioeconomic status, was motivated by several considerations:
- In developing economies, where large portions of the population do not earn formal wages, measures of income are notoriously unreliable. Instead, researchers and policymakers rely on asset-based wealth indexes or measures of consumption expenditures.
- Between these two, wealth is much less time consuming to record in a survey. As a result, wealth data is more commonly collected in a standardized format for a large number of countries.
- This therefore lends itself to the FH method being easily replicated and reproduced in a wide variety of case studies in less developed economies around the world.
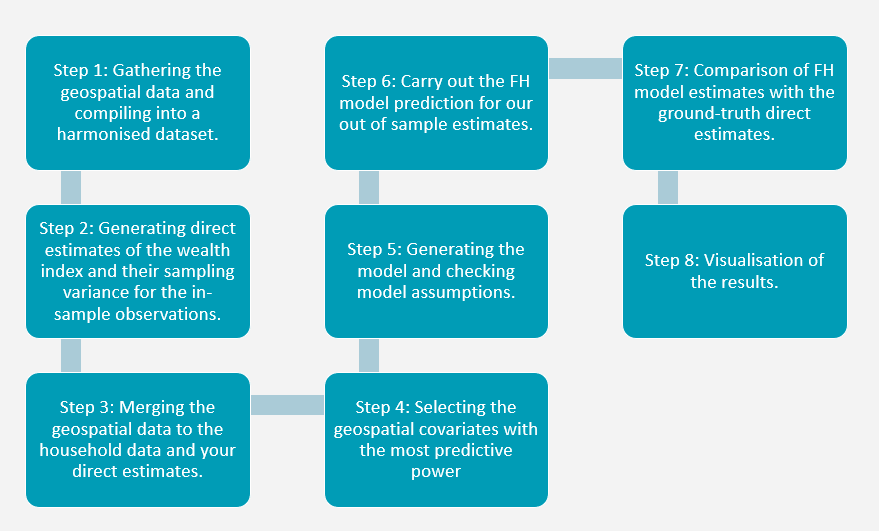
1.4 Steps of the guide
Using the Fay-Herriot model as a method to produce out of sample estimates of poverty initially seems like quite an involved process. However, the main steps are quite simple. You first gather your geospatial data and download the DHS household survey responses from online. You then calculate the direct estimates of poverty in the country using the DHS household survey. The reason you cannot simply use the numbers in the survey is because DHS employs a sampling strategy to gather their data and this needs to be accounted for and the numbers need to be adjusted in order to make the estimates as precise as possible. You then select the most significant geospatial covariates at predicting poverty and use them in a Fay-Herriot model to generate your out of sample poverty estimates. These estimates are then used to visualise the spatial distribution of poverty in the country.
The remainder of the steps in the process are used to ensure the robustness and precision of the estimates. The FH model has a few assumptions that you need to check are not violated, especially if you are using the model to predict out of sample estimates. It is therefore vital that these steps are followed if the estimates produced are to be used to guide policy decisions in the future. The steps of the guide are shown in Figure 1.1 below.