3 Introduction
Section A is our first step into poverty modelling in Bangladesh. Here, we will obtain and transform various geo-spatial data sets (such as accessibility, nightlights intensity, demographic maps, and topography) into predictors of poverty rates. This data has been sourced through a combination of ground surveys and remote sensing (collected by satellites and remote sensors orbiting the Earth). Geo-spatial variables are important inputs into poverty estimation models. Outputs from such models fill spatial and temporal gaps that exist between official poverty statistics. This is due to the many advantages of remote sensed geo-spatial data:
Has wide coverage and typically includes data from low-and-middle-income countries (LMICs).
Covers areas that would otherwise be difficult to access, such as mountain ranges, islands, and conflict zones.
Can be obtained at a high spatial resolution - in some cases as high as 30m x 30m (which is the resolution of the population density maps that we will be using).
Measurements can be collected frequently. For instance, the ERA5 climate data set from the European Centre for Medium-Range Weather Foecasts (ECMWF) contains measures of temperature for every hour. This is a particulary exciting aspect as in theory you could have a dynamic poverty map which updates itself as new geo-spatial data becomes available!
The main goal of Section A will be to produce a “harmonised geo-spatial covariate raster for poverty modelling”. In other words, layers of geo-spatial information in a raster format (a collection of pixels) for each small area that can be used to estimate poverty. In our case, small areas will be upazilas in Bangladesh, which is the administrative level 3.
Imagine that each upazila is divided into pixels. Each pixel will contain some geo-spatial information: slope, travel time to healthcare facilities, distance to nearest water source etc. Harmonising them means that all of our geo-spatial layers are in the same format: CRS, extent, spatial resolution, and shape. Why is this necessary? Short answer: so that each pixel with values of geo-spatial data describes the same location across all our geo-spatial datasets.
Long anwer: In order to predict poverty rates for upazilas, we need to know some basic statistics (mean, max, min, sd etc.) for the values of our geo-spatial variables at upazila level. For example: what is the mean population density of women and nightlights intensity in each upazila in Bangladesh? We would only be able to answer this question if our layers showing population density for women and nightlights were aligned: they had the same CRS (projection), extent (maximum and minimum values of geographical coordinates), spatial resolution (size of pixels), and shape of Bangladesh. That is, we need comparable pixels with data values that can be assigned to upazilas.
Finally, we will need a shapefile that defines the boundaries of each administrative zone - so that we can assign each pixel with geo-spatial information to the right upazila.
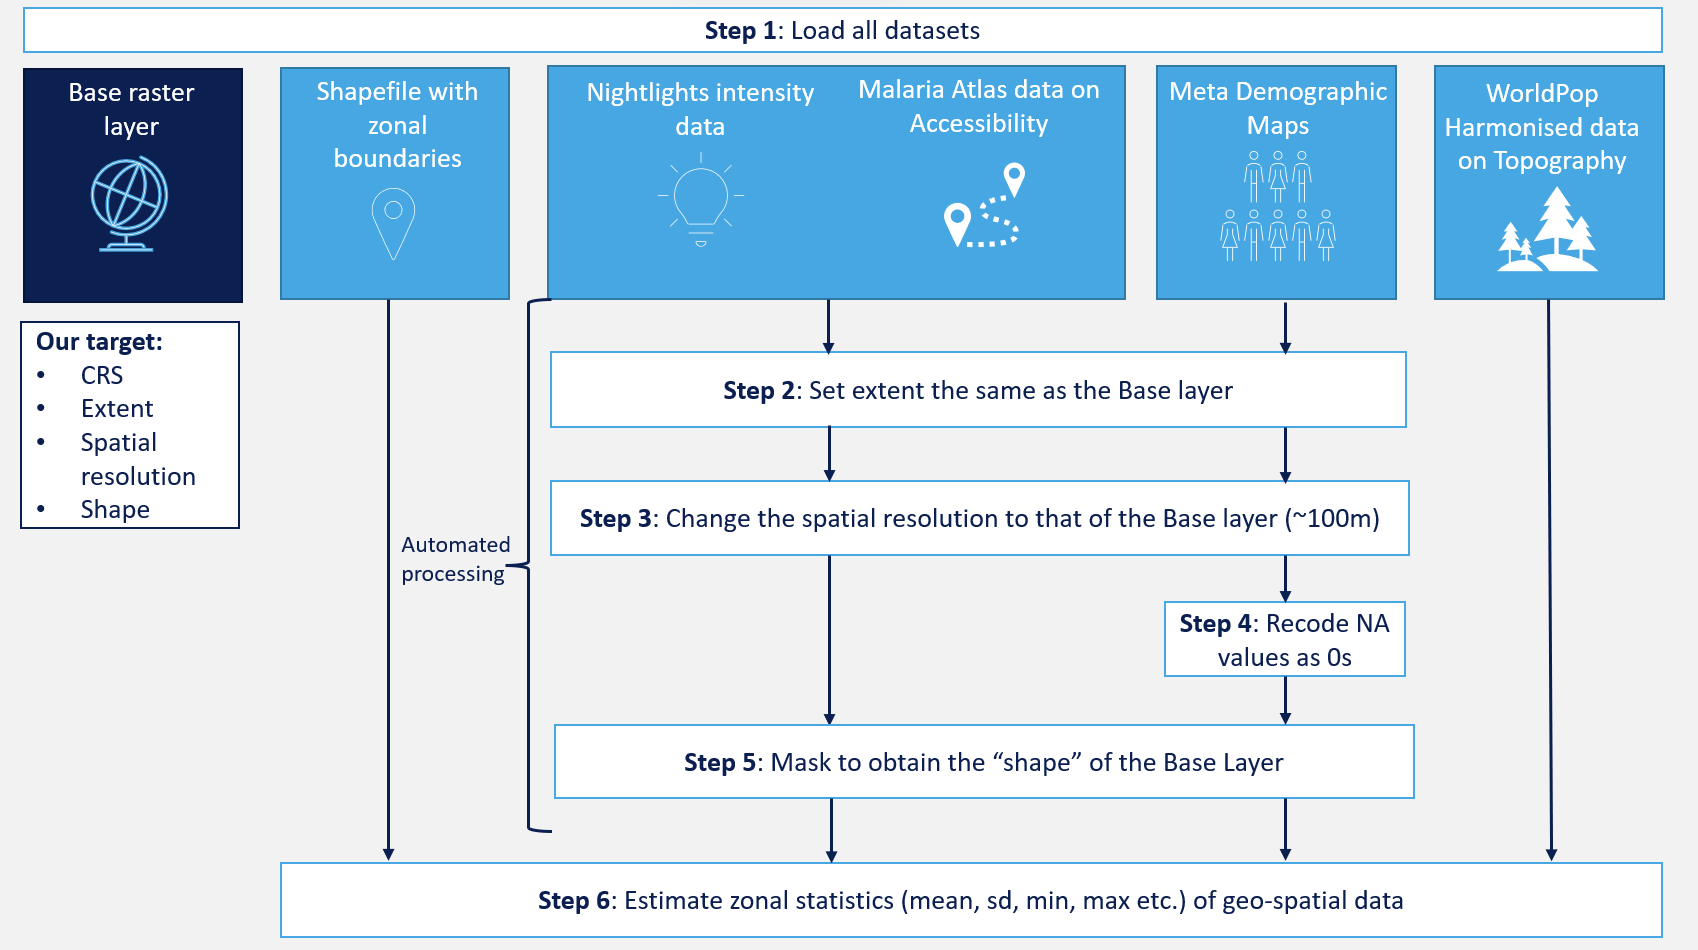
Figure 3.1 below demonstrates the process in six steps:
Step 1: Load all datasets. Those are divided into 6 categories:
- Base raster layer - this raster contains the target values of parameters, such as: CRS, extent, spatial resolution, and shape. We will be harmonising to this base layer, i.e. we want all our other layers to look like this one.
- Shapefile with zonal boundaries - we need this to define the administrative boundaries of upazilas in Bangladesh.
- Nightlights intensity data
- Malaria Atlas data on accessibility
- Meta Demographic Maps
- WorldPop Harmonised data on Topography.
Datasets no. 3-5 will need harmonising, while the World Pop datasets are pre-harmonised and do not need any processing from us.
Step 2: Set extent the same as the Base Layer. We want our layers to cover just Bangladesh (as opposed to, for example, the entirety of South-East Asia). Setting the extent will ensure that we are working within the same range of coordinates.
Step 3: Change the spatial resolution to that of the Base Layer (~100m). This means all our data will be organised into pixels covering an area of 100m x 100m.
Step 4: (only for Meta Demographic Maps): recode missing values as 0s.
Step 5: Mask to obtain the “shape” of Bangladesh.
Step 6: Estimate zonal statistics (mean, max, min, sd etc.) for each geo-spatial dataset for each upazila.